Blog
The latest posts from our blog
A Zine to Show Scientists How to Make Their Data More Accessible
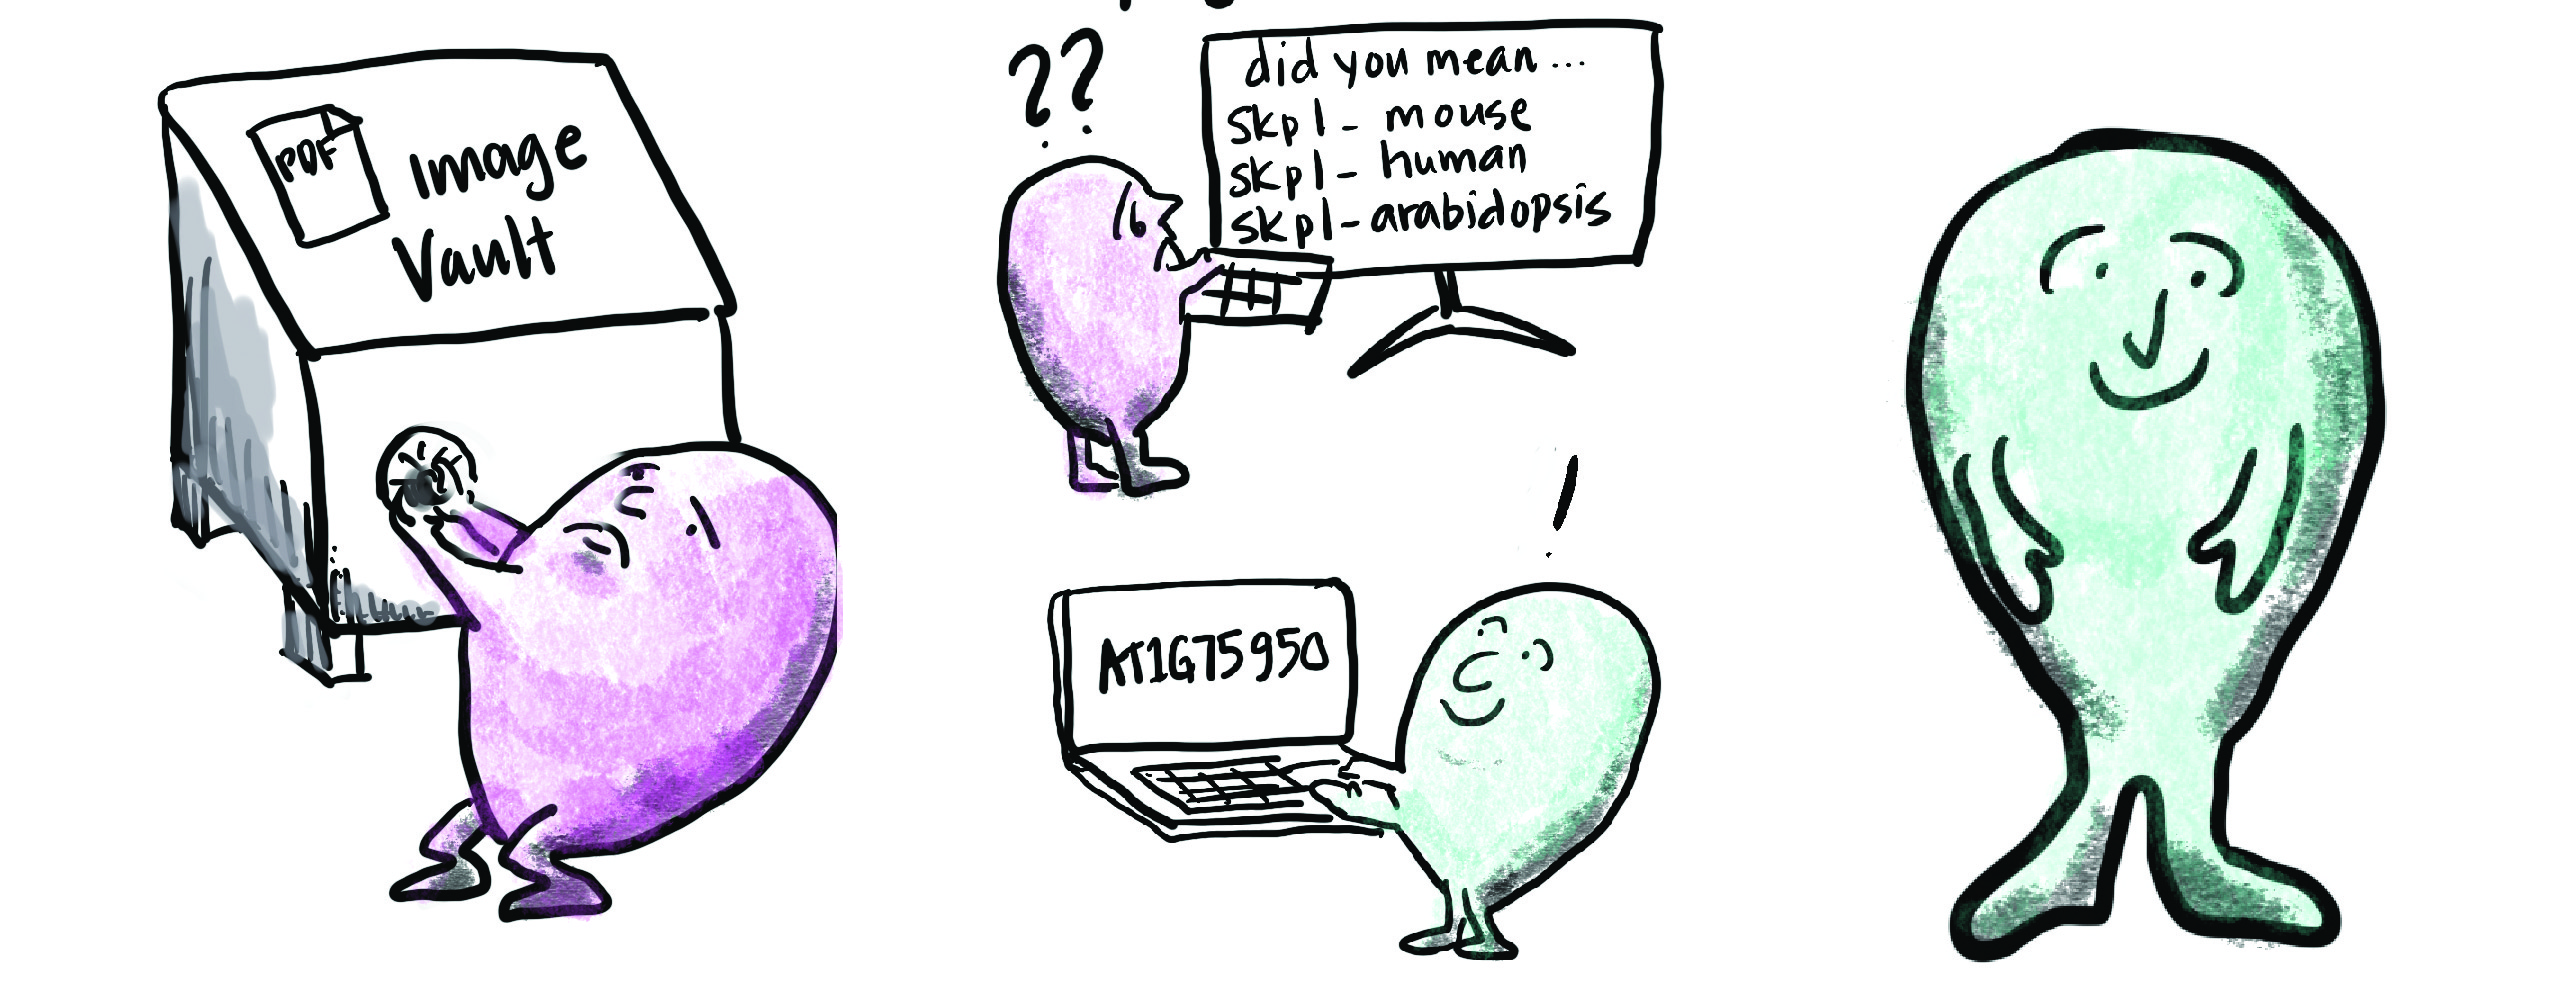
Leonore Reiser creates a zine to help communicate best practices of sharing plant DNA data. Read More
Sweeping Untufted Charts Under the Rug
Violeta Roizman experiments with tactile ways to present data by creating a data viz rug. Read More
A Conversation With Mimi Ọnụọha
An interview with artist Mimi Ọnụọha on their background and process of making work exploring power dynamics behind data collection. Interviewed by Natalie O’Shea. Read More
The Process of Making “The Count”
This article follows the process of the development of “The Count”, an analysis of the 2019 Nigerian elections. It was developed by Bunmi Aworanti & Deji Dabiri1. Read More
An ode to the summer camp vibes of #CreatorConf
Overview of DSxD hosted virtual conference that brought together creative data enthusiast across all fields. Read More
Spark data inspiration through the inspiRe package
Collaboratively share inspiration with this R package by Sara Stoudt Read More
2021 Overview!
We’re ramping up for an exciting year, and want to share our plans with you! Read More
Announcing Data Science by Design
Introducing Data Science by Design (DSxD) and letting the world know what we are about. Read More


