13 July 2022

Beyond Binaries

This piece is motivated by my desire for scientific inquiry that is ethical and socially responsible. Simplistic binary thinking, which can both amplify and erase differences in harmful ways, can be challenged within scientific communities using both art and data approaches.

The ideas in this zine draw from my reflections as a researcher studying the biological basis of sex differences and are a response to the question “How can we queer science?”

Additionally, an alternative framework for understanding autism spectrum disorder outside the traditional “high functioning” and “low functioning” categories, offered by Hari Srinivasan in a Berkeley class on autism, inspired the theme. The zine format is great – approachable, fun, and cheap! – and I’ve found it’s an easy way to start a conversation about new ways to think and communicate about data.
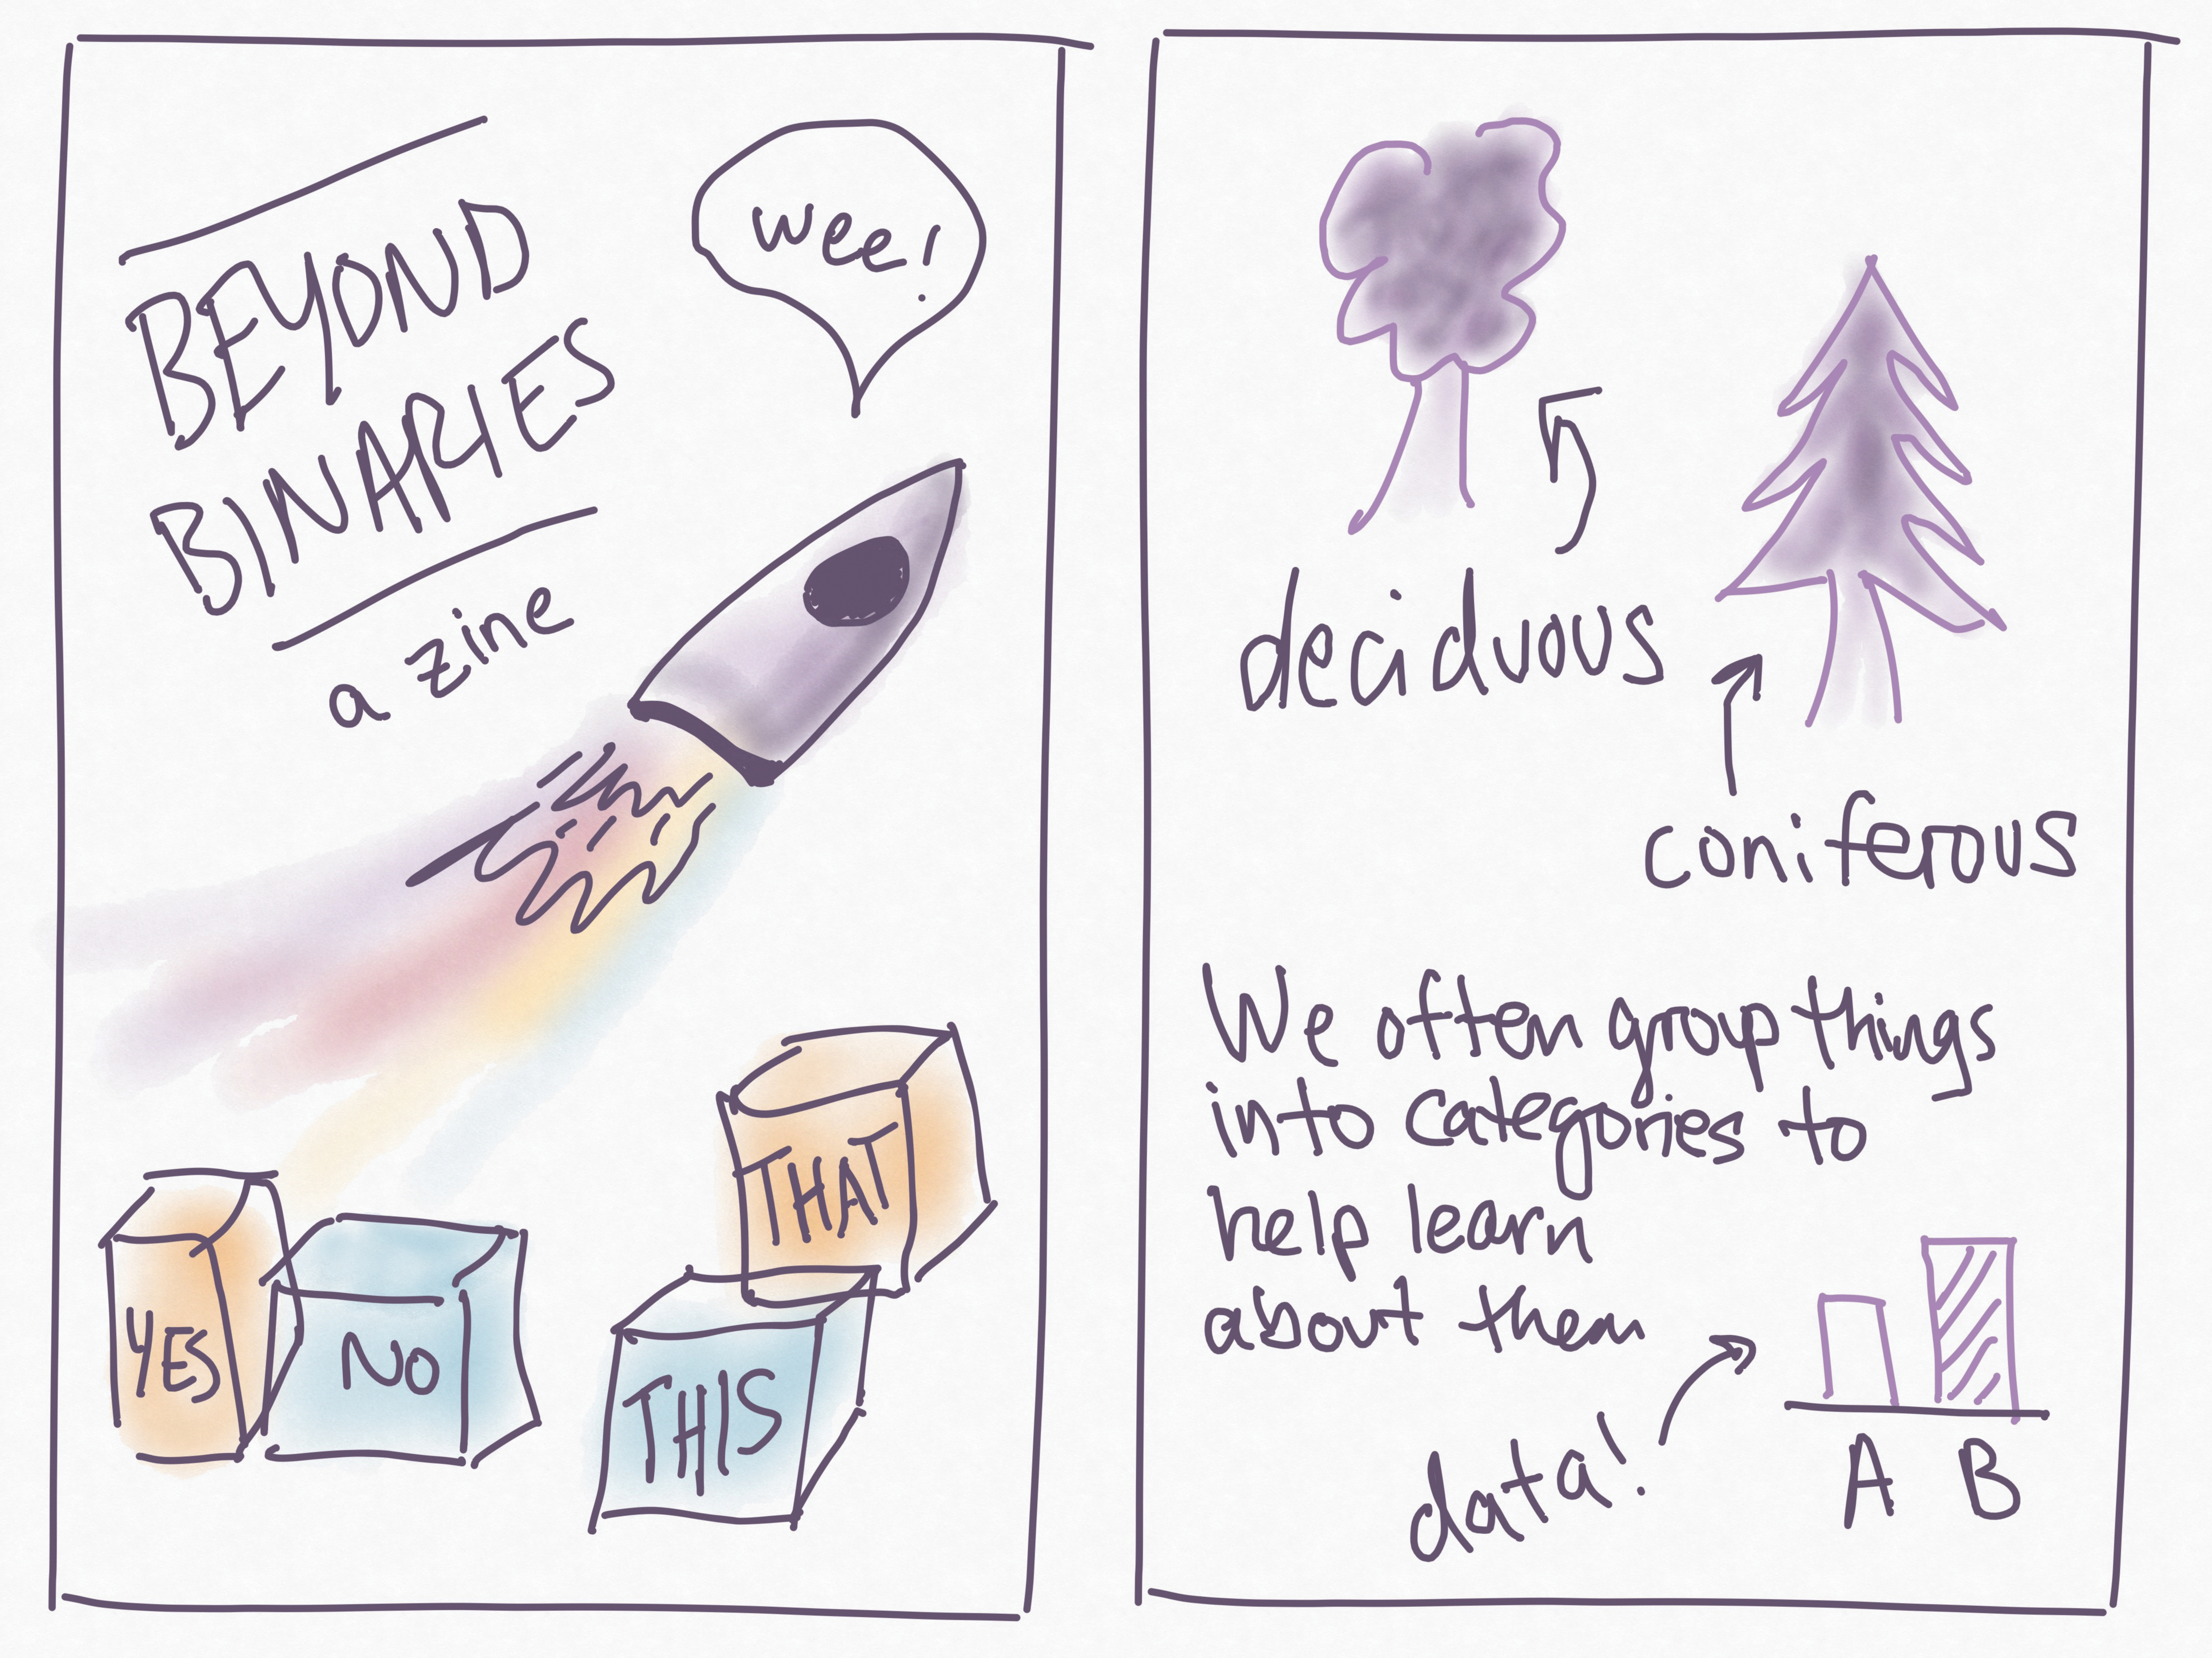
Panel 1: Beyond Binaries title, with a rocket with speech bubble saying “wee!”. There are also two pairs of boxes of different colors. One pair says yes and no and the other pair says this and that.  Panel 2: We often group things into categories to help learn about them.  There are two tree one is labeled deciduous and the other labeled coniferous.  There is a small bar graph in the corner.

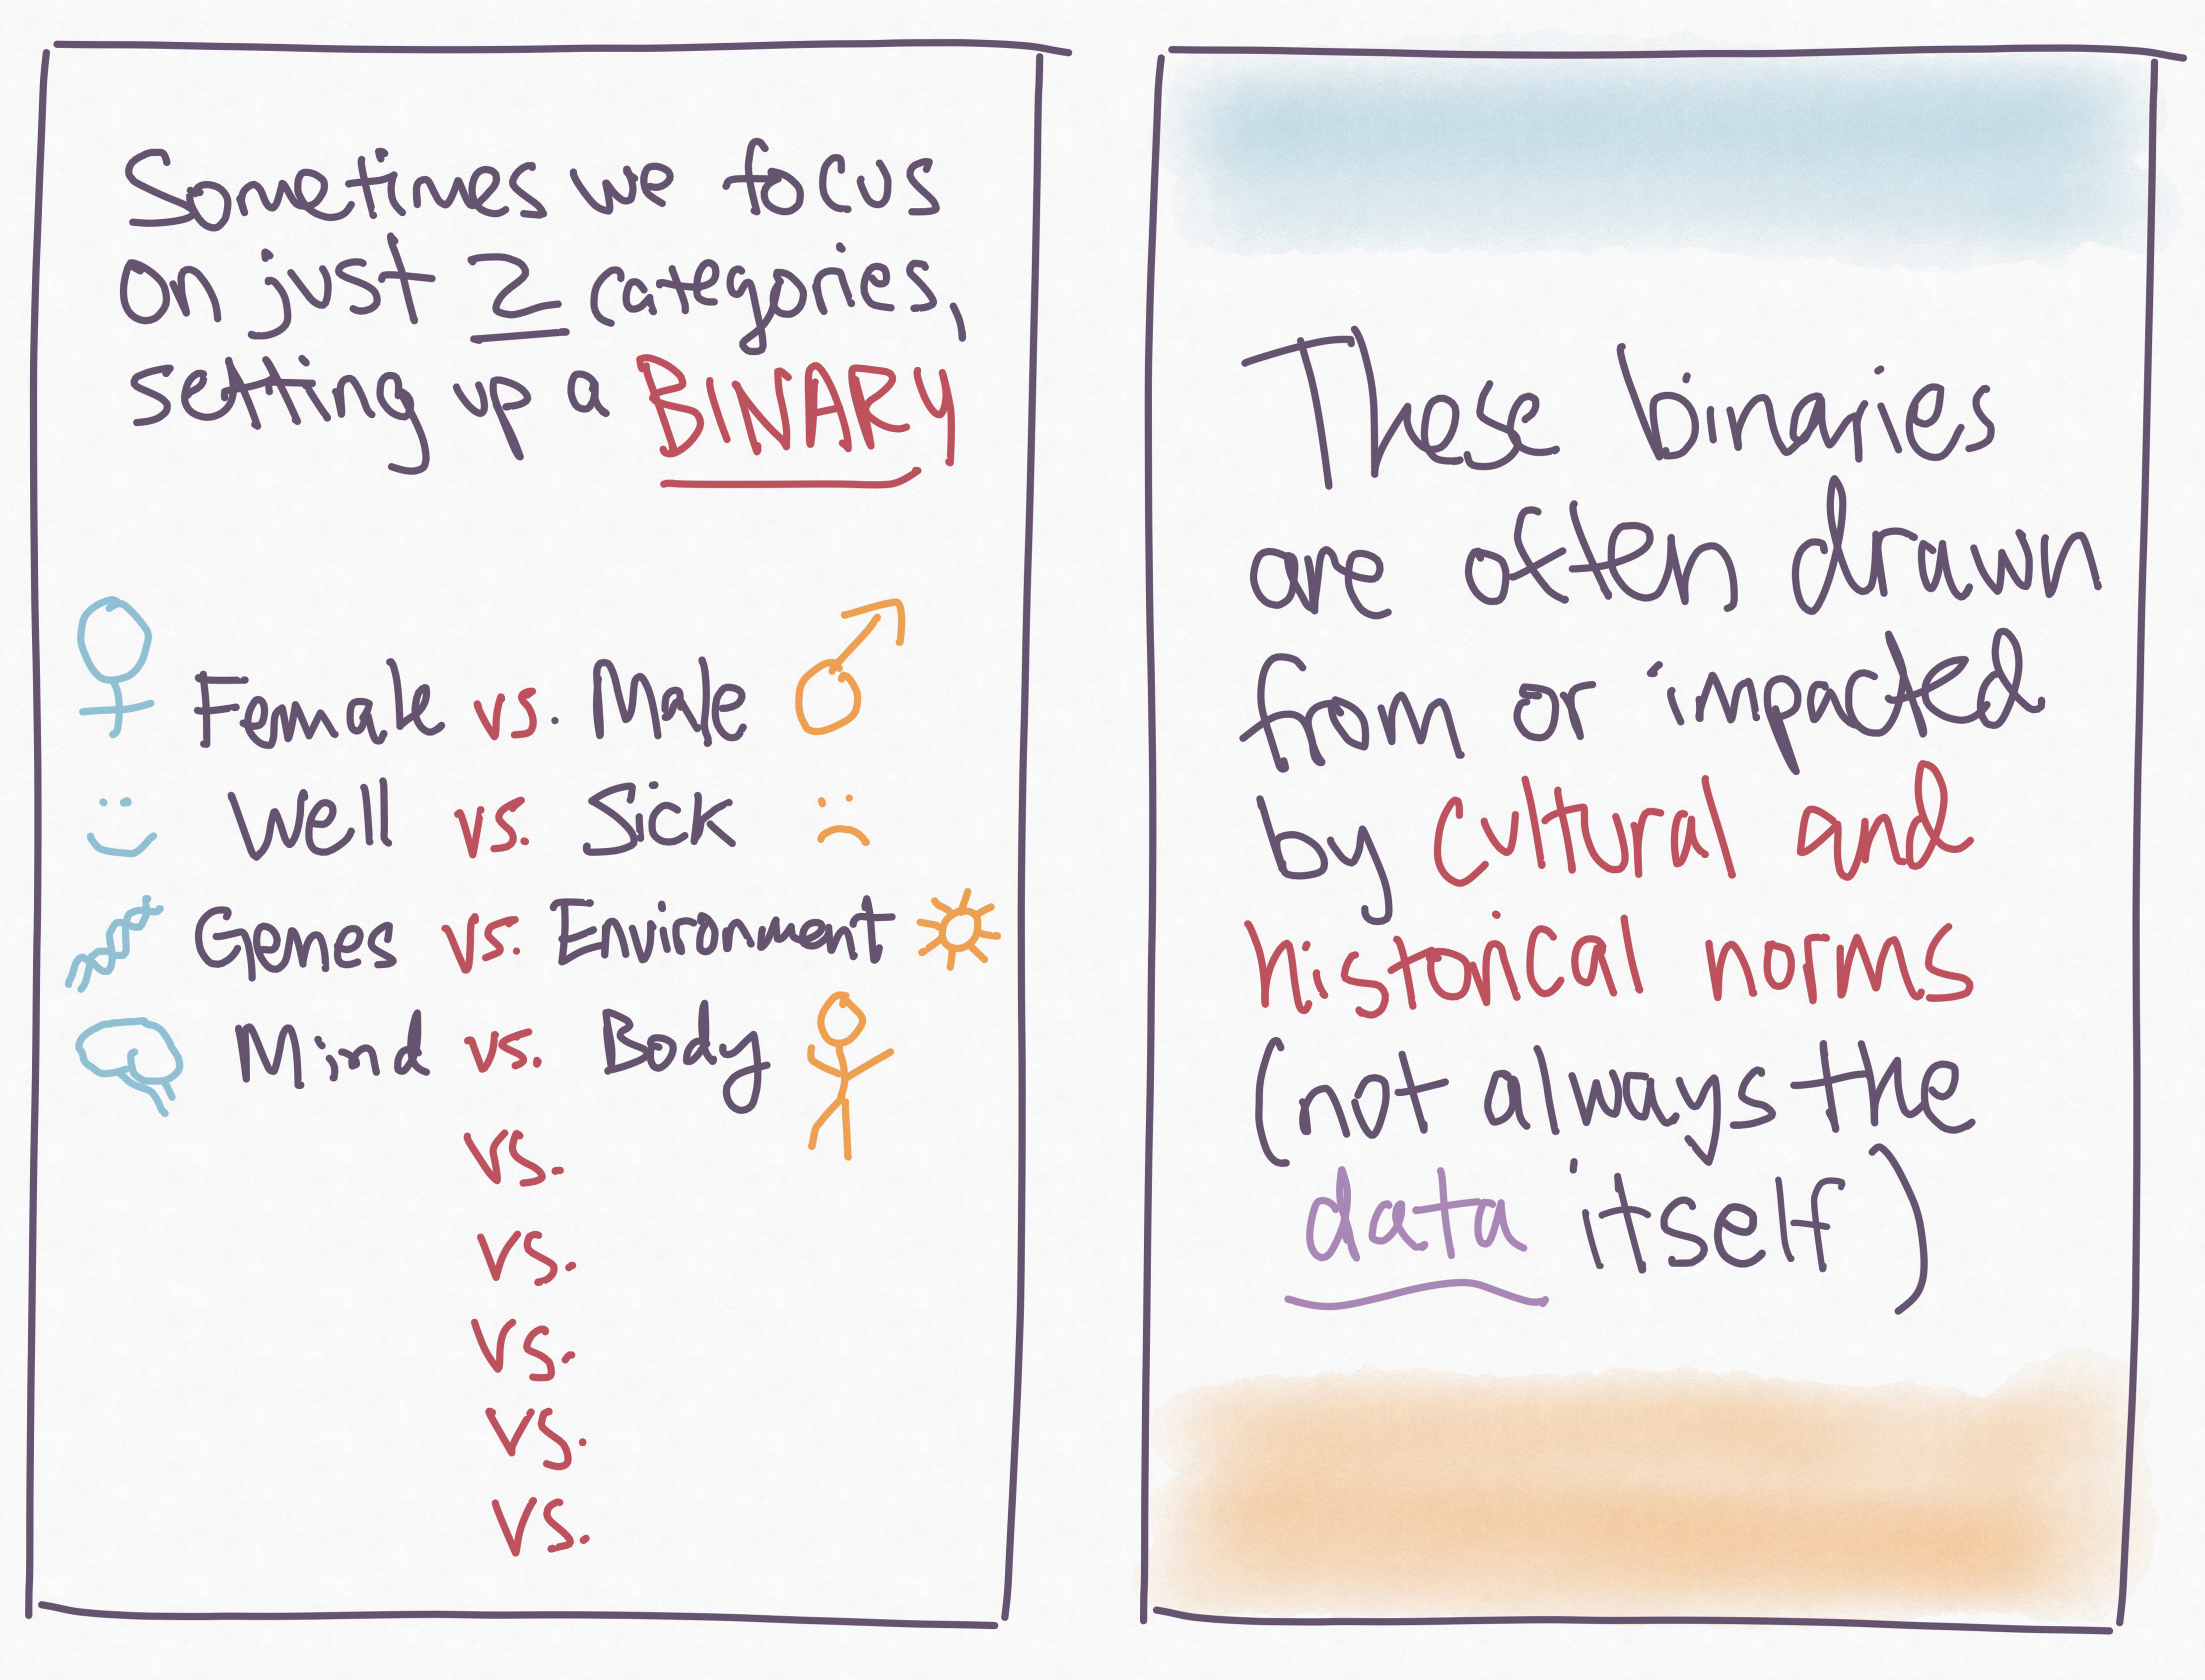
Panel 3: Sometimes we focus on just 2 categories, setting up a Binary.  Female vs Male.  Well vs Sick. Genes vs Environment.  Mind vs Body.Panel 4: These binaries are often drawn from or impacted by cultural and historic norms.  (Not the data itself.)

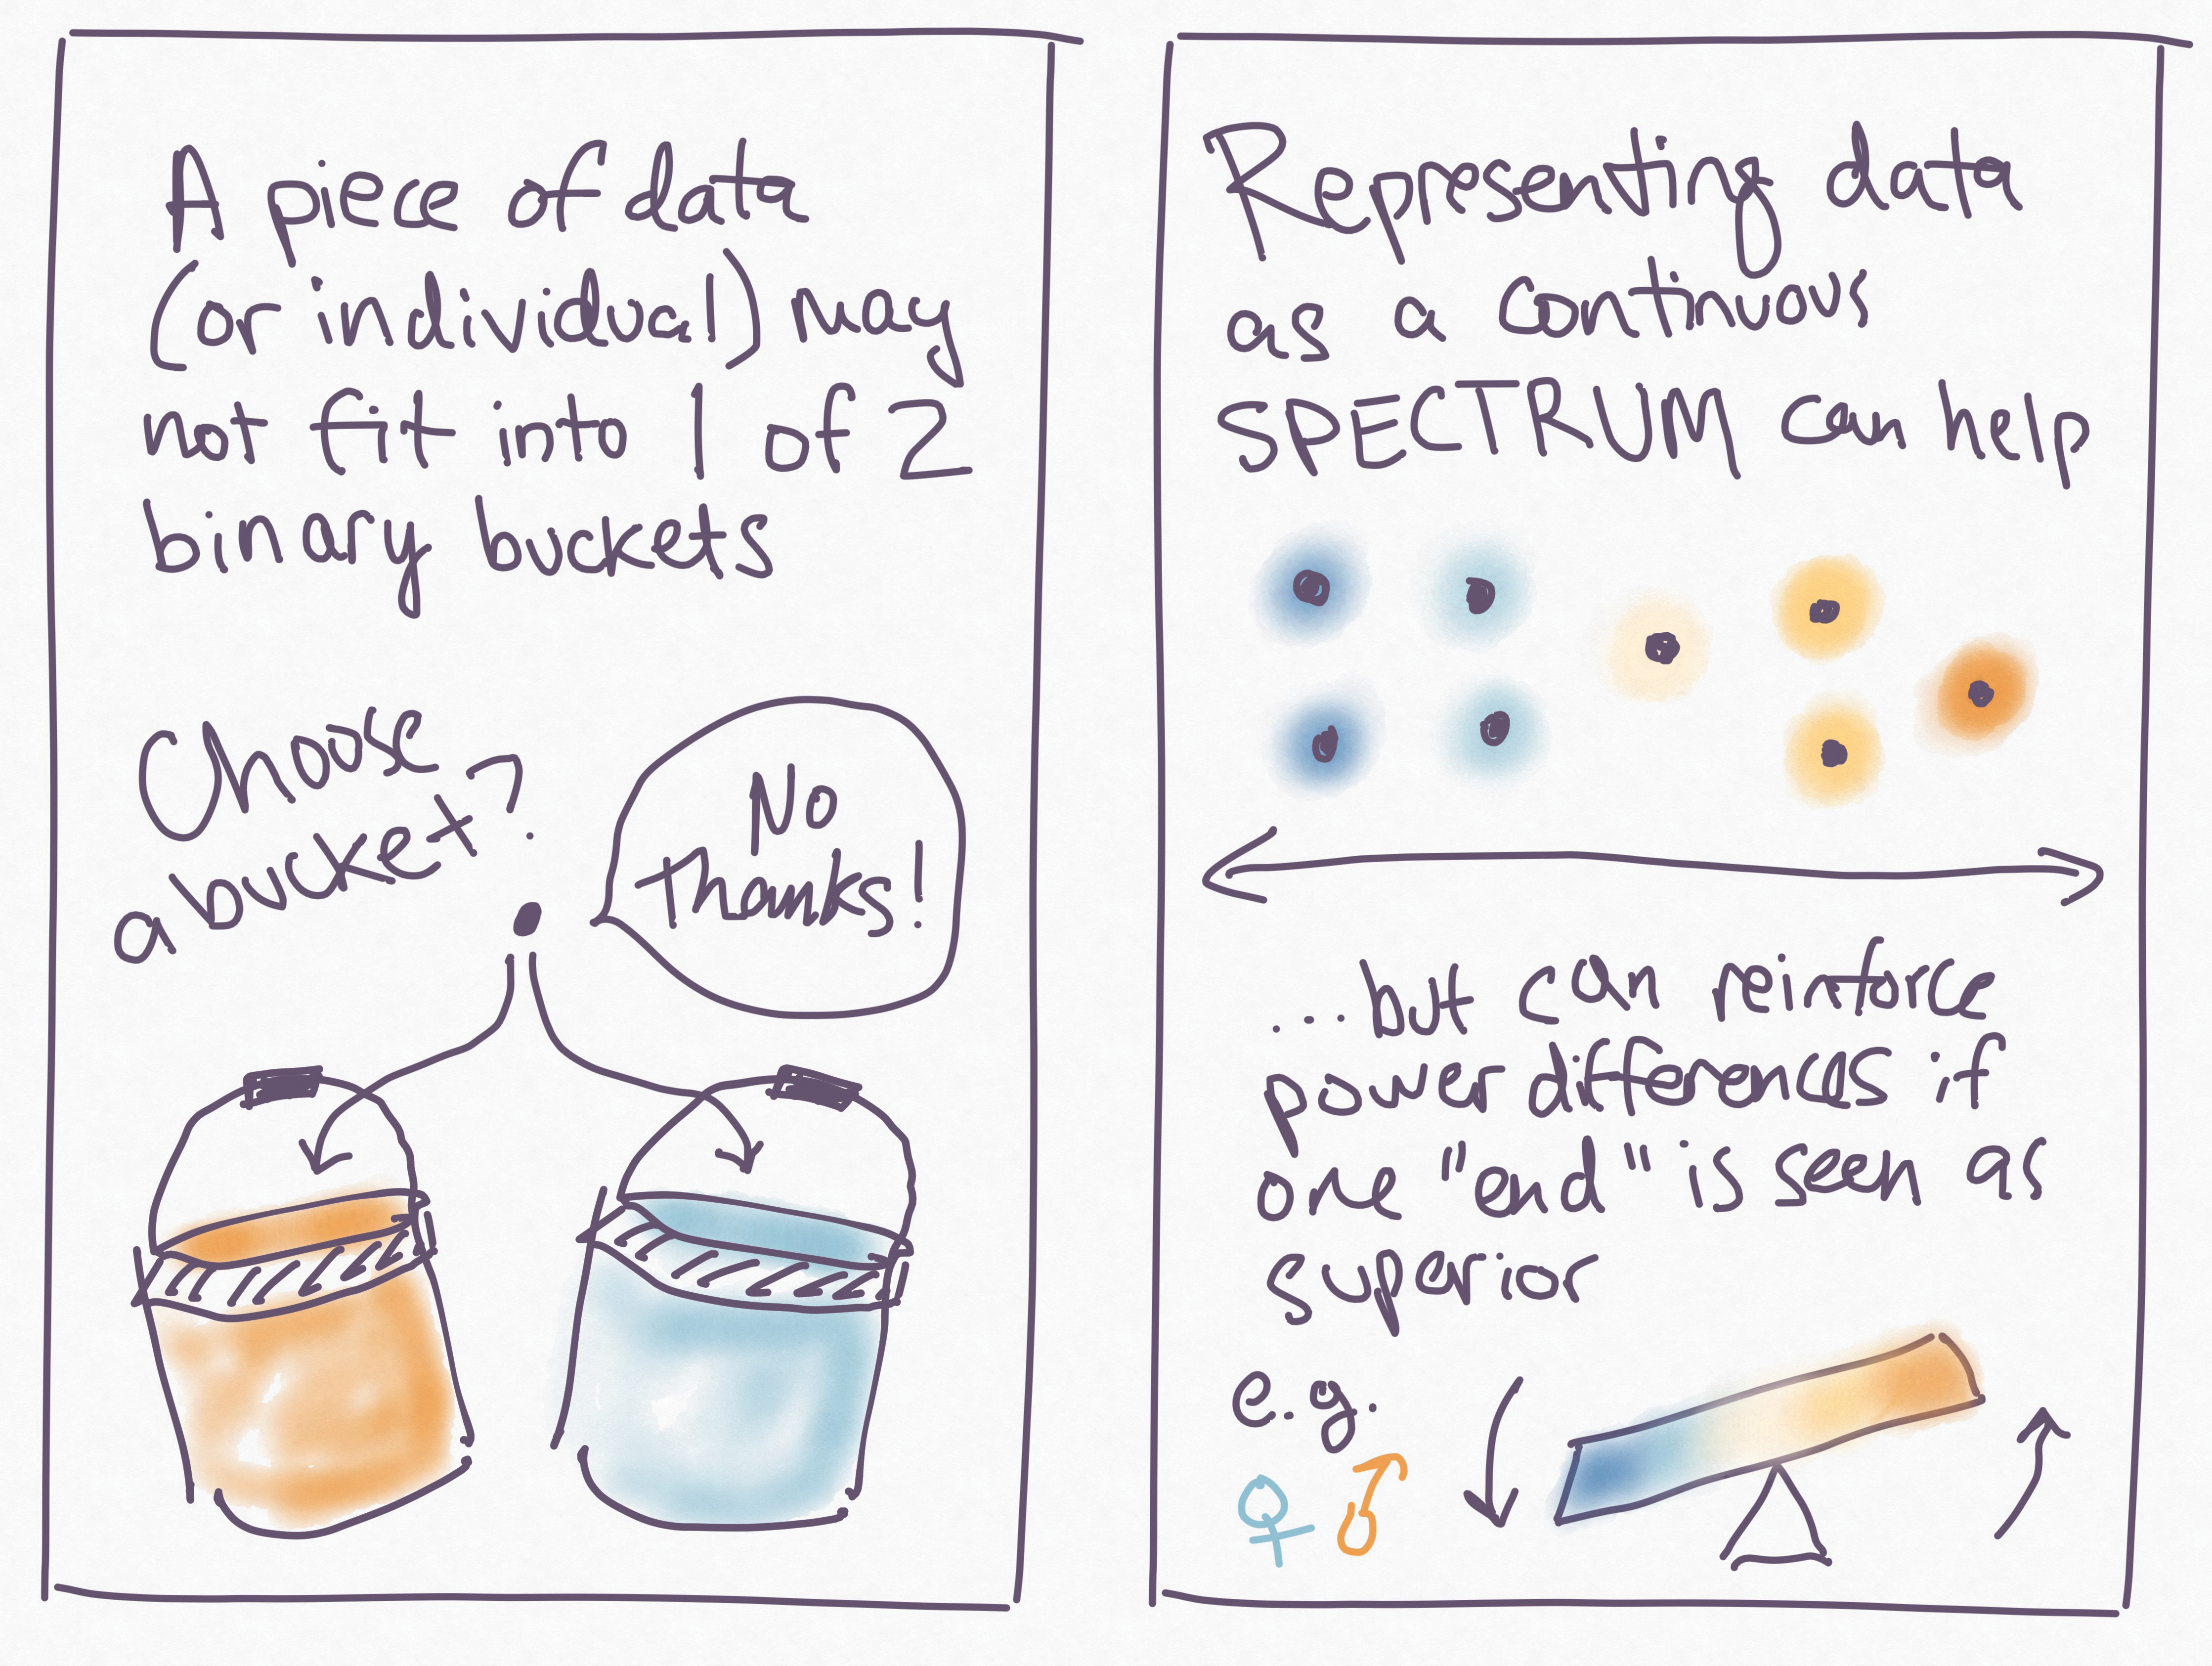
Panel 5: A piece of data (or individual) may not fit into 1 or 2 binary buckets.  There is an illustration of two different colored buckets with the words “choose a bucket”. A small dot is saying “no thanks” in a speech bubble. Panel 6: Representing data as a continuous spectrum can help…but can reinforce power differences if one “end” is seen as superior.  There are illustrations of colored dots on a spectrum and an off balance beam with a colored gradient representing male and female.

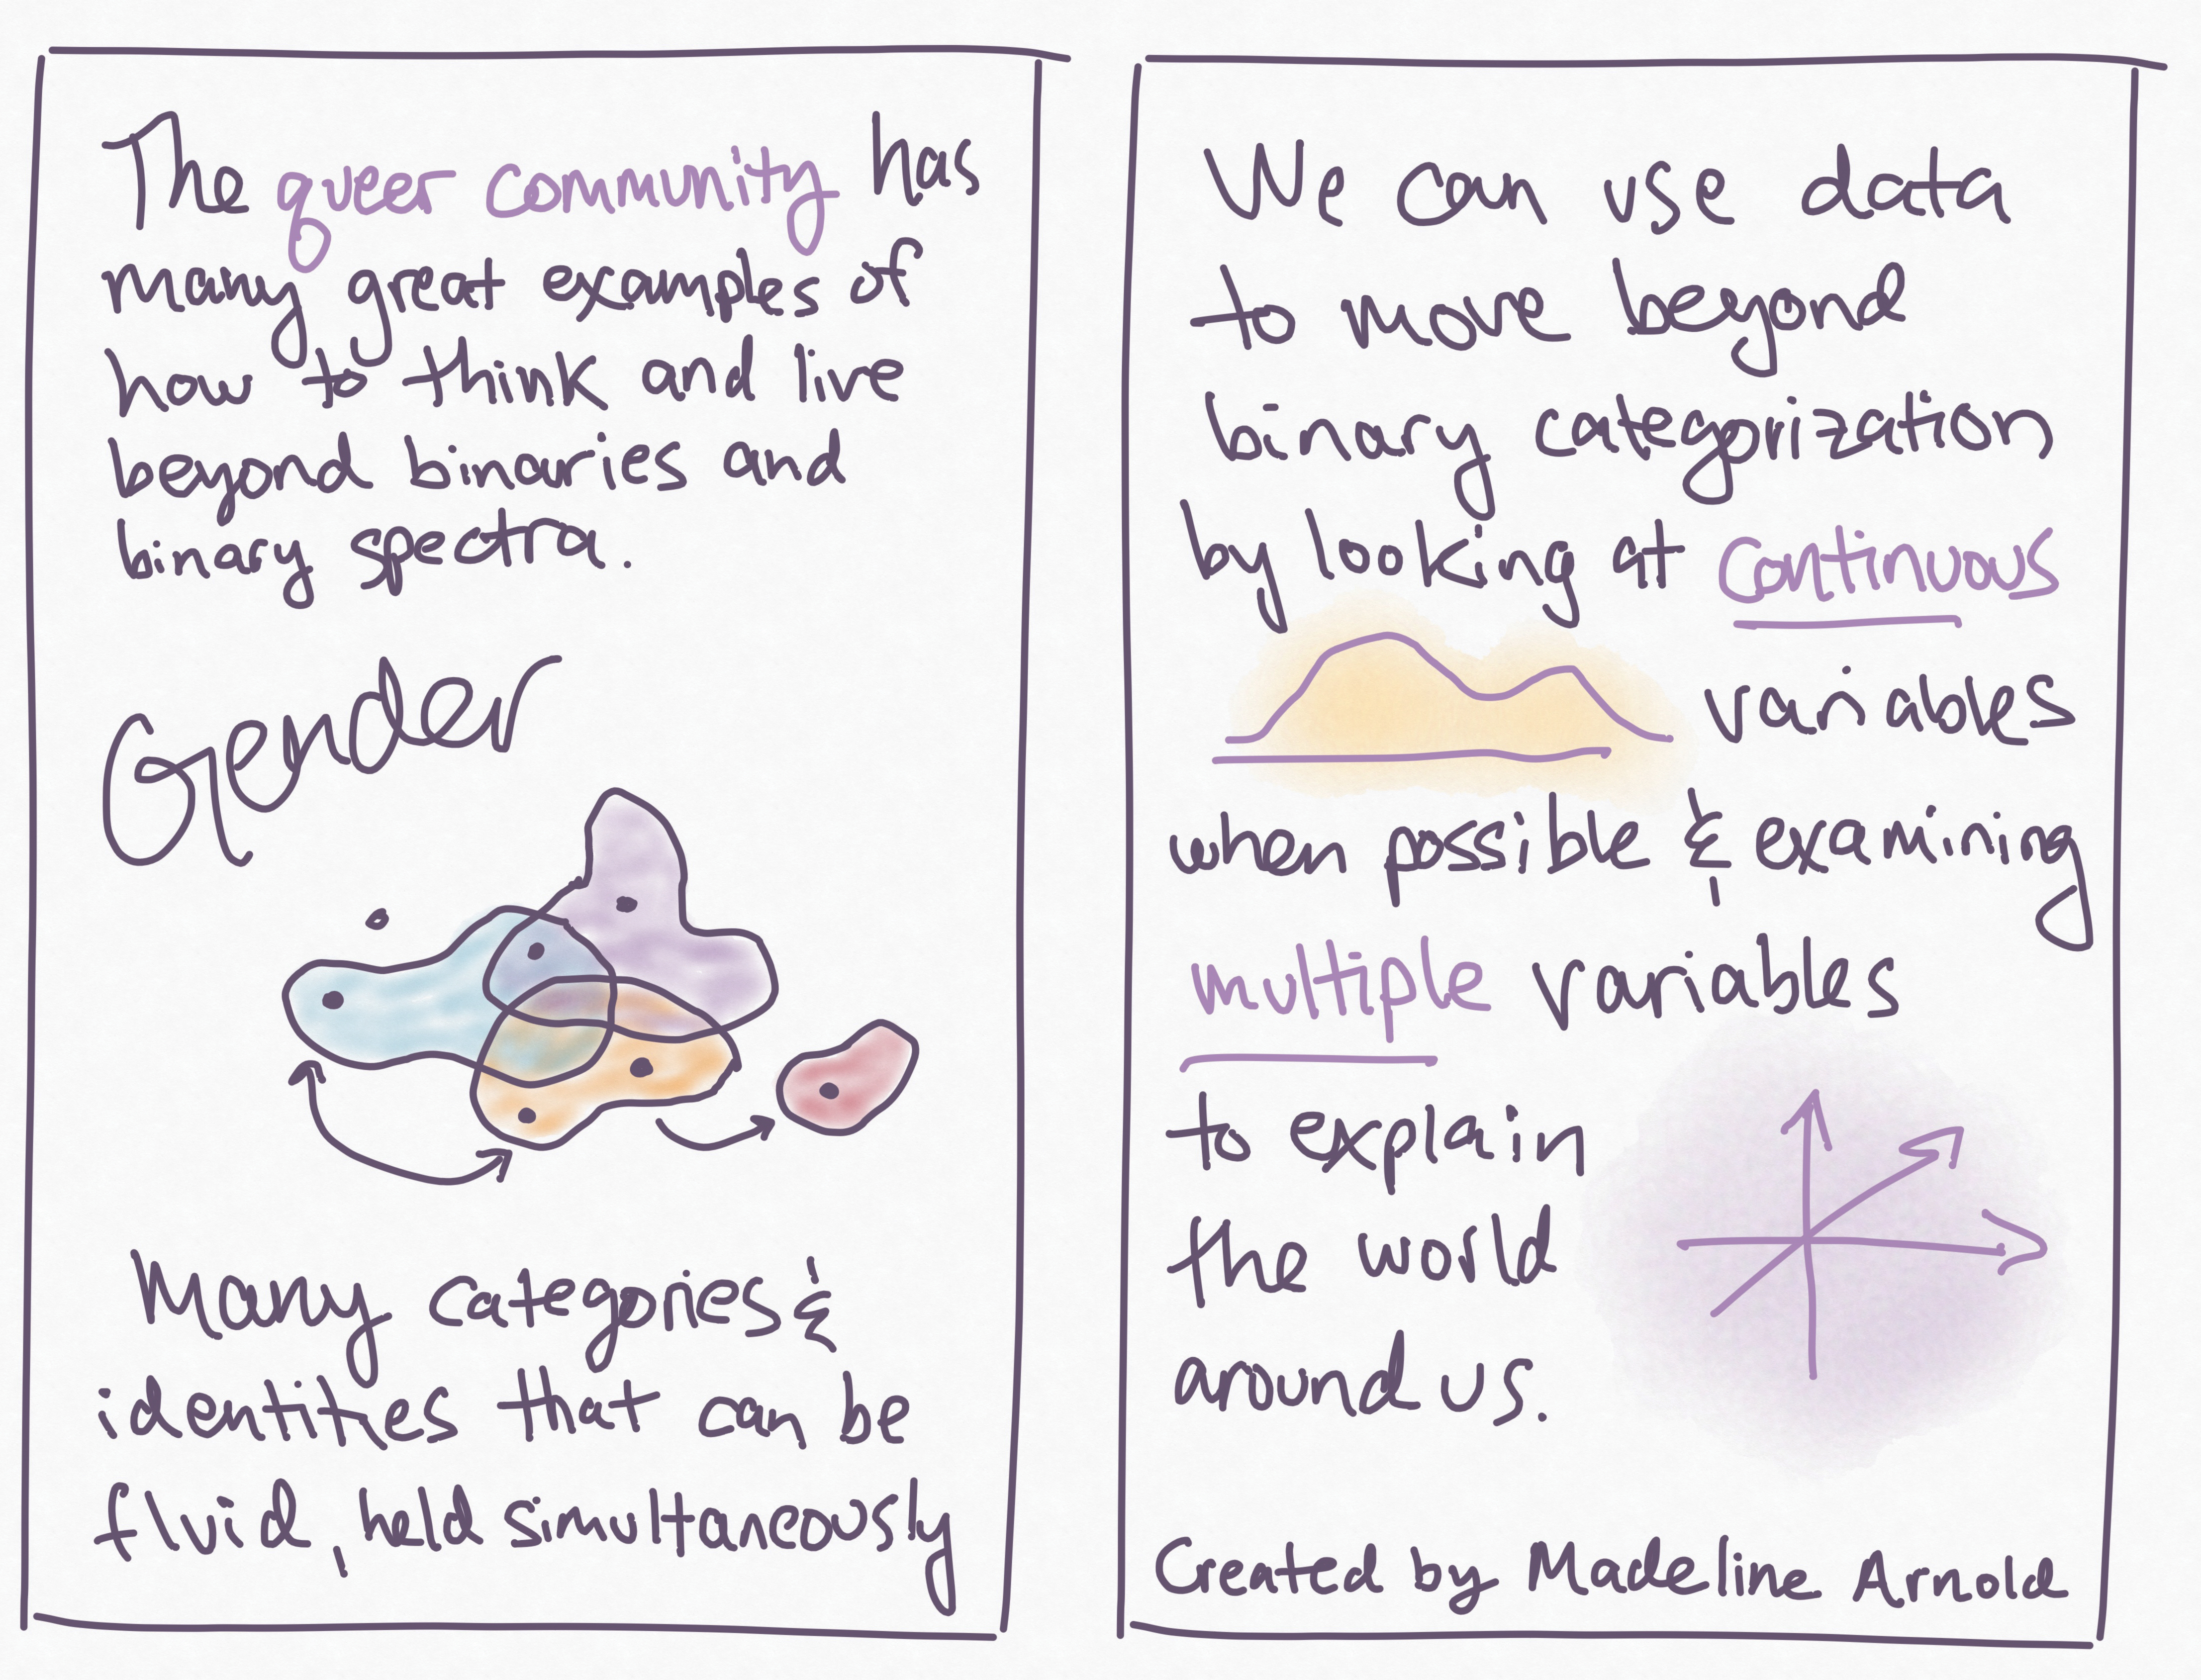
Panel 7: The queer community has many great examples of how to think and live beyond binaries and the binary spectra. Many categories and identities that can be fluid, held simultaneously. An illustration of overlapping and non overlapping colored shapes representing gender.Panel 8: We can use data to move beyond binary categorization by looking at continuous  variables when possible and examining multiple variables to explain the world around us. Created by Madeline Arnold. Illustrations of a line graph and three arrows overlapping in different directions.

Madeline Arnold is a scientist and science communicator who combines data, art, and community to address social issues. She is currently a doctoral student at UC Berkeley researching how the immune system impacts brain development in sex-specific ways and working on evidence-based interventions to improve equity and belonging in science. Madeline envisions a future where data and the scientific enterprise are accessible and community-based, generating insight and delight for everyone.